If you manage more than one site, you probably already deal with utility data every day. Monthly bills arrive. Meters get read. Spreadsheets get updated. The problem isn’t a lack of data — it’s that having data isn’t the same as being able to use it.
A facility manager managing multiple properties, each with different billing cycles, tariff structures, and sometimes different utility providers, can spend hours each month just assembling numbers into a comparable format — before any actual analysis begins. By the time the numbers are usable, the month they describe is already over, and any anomaly buried in that data has had weeks to run unnoticed.
This is the gap between collecting utility data and managing it. This article looks at how that gap actually gets closed — and what structured facility utility monitoring should look like in practice, from benchmarking across sites to catching exceptions before they become bigger problems.
What Is Utility Data Management?
Utility data management is the process of collecting, consolidating, standardizing, and analyzing consumption and billing data — electricity, water, gas, and district cooling where applicable — across one or more facilities, so it can be used to make operational and financial decisions.
It typically draws on a mix of sources: monthly utility bills, meter readings (manual or automated via smart meters), sub-metering data at the equipment or zone level, and sometimes building management system (BMS) exports. The distinction that matters here is between collecting and managing:
- Collecting data means the numbers exist somewhere — a filing folder of PDF bills, a shared spreadsheet, a handful of meter logs.
- Managing data means those numbers are centralized, standardized into consistent units and time periods, checked for gaps or errors, and organized in a way that supports comparison and analysis.
A facility can have years of utility data and still have no real utility data management, if that data has never been consolidated into a form that supports a decision.
Why Multi-Site Facilities Struggle With Utility Data
The challenges compound with every additional site. A few of the most common:
- Scattered bills. Different sites, different providers, different formats — sometimes a PDF, sometimes a portal login, occasionally still paper.
- Different meter types and granularity. Some sites may have smart meters providing granular, near-real-time readings; others rely on manual monthly reads.
- Inconsistent billing periods. One site’s bill covers the 1st to the 31st; another’s covers a rolling 28-day cycle. Comparing “this month” across sites isn’t as simple as it sounds.
- Missing or incomplete data. A missed meter reading, a delayed bill, or an estimated (rather than actual) charge can quietly distort a month’s figures.
- Tariff differences. Two sites using the same amount of electricity can show very different costs if they sit on different tariff structures or peak/off-peak rates.
- Manual spreadsheet consolidation. Many facility teams still manually retype bill data into spreadsheets — a process that’s slow and introduces transcription errors.
These challenges are common among organizations managing multiple facilities before they adopt a structured utility data management approach.
From Utility Bills to Structured Data
Turning scattered bills into something usable follows a fairly consistent path:
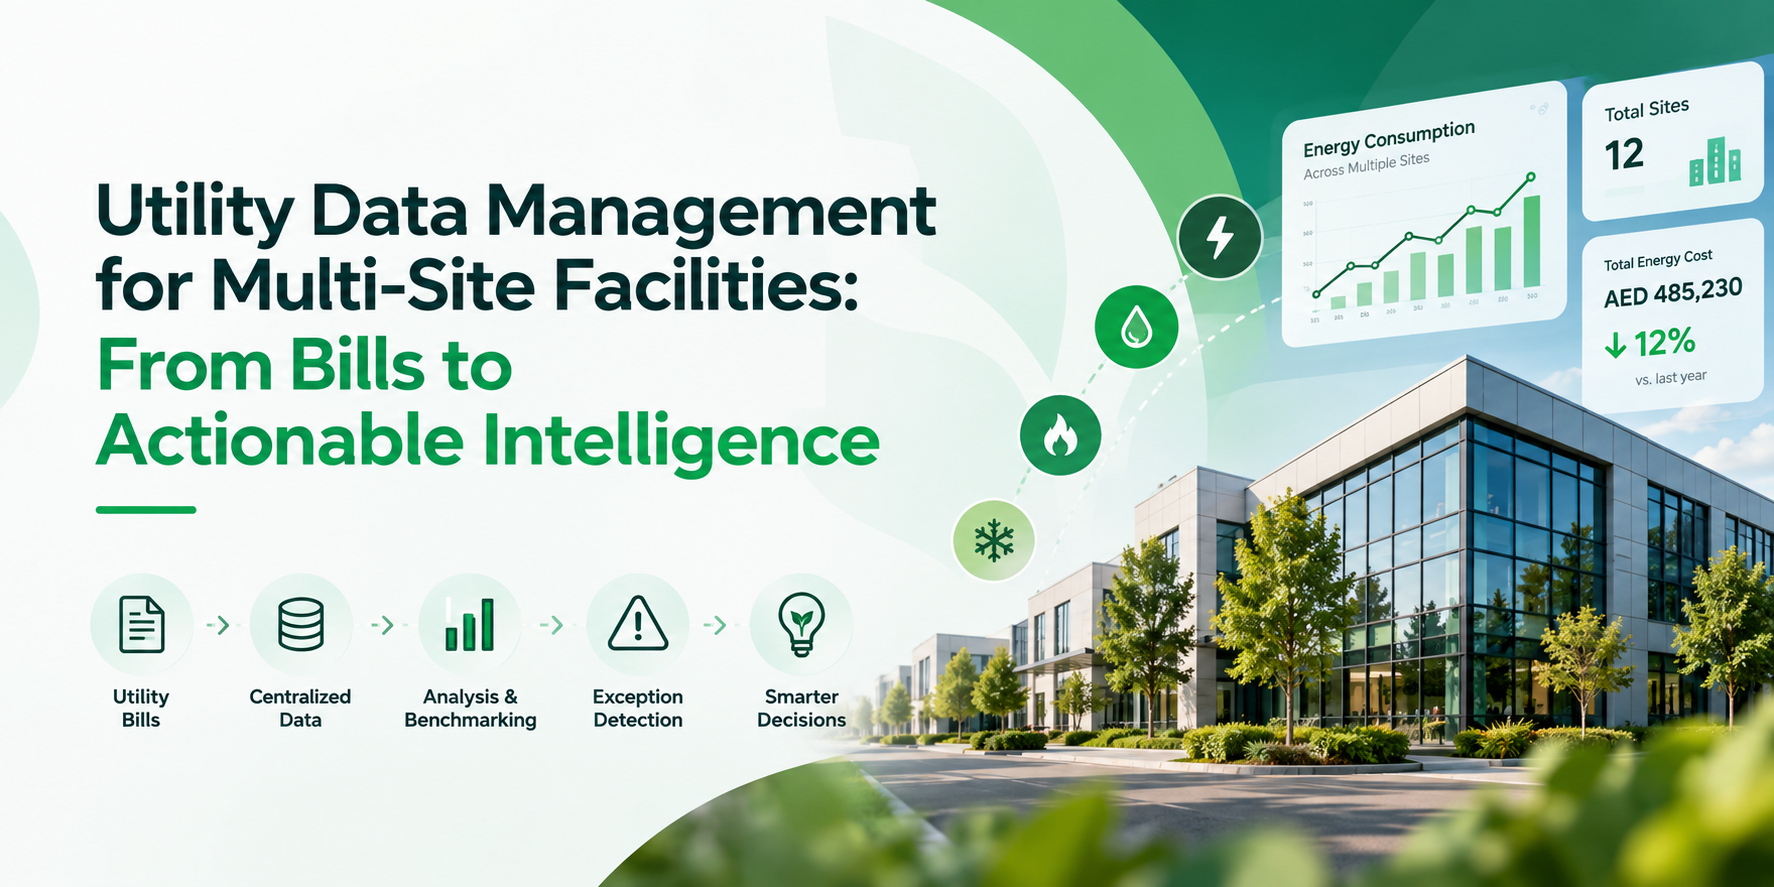
Bills and meter readings → centralized data → standardized data → analysis → benchmarking → exception detection → decisions
In practice, this means:
- 1. Centralizing — pulling bills and meter data from every site into one system, rather than leaving them distributed across inboxes, portals, and local files.
- 2. Standardizing — converting everything into consistent units (kWh, m³, AED) and aligned time periods, so a “month” means the same thing across every site.
- 3. Analyzing — once standardized, the data can be queried, trended, and compared in ways a folder of PDFs never allows.
- 4. Benchmarking — comparing sites against each other, or against their own historical performance, in a way that’s actually fair (more on this below).
- 5. Flagging exceptions — surfacing consumption that falls outside expected ranges, so someone can investigate before it becomes a much larger cost.
- 6. Deciding — using all of the above to prioritize where to invest maintenance attention, capital upgrades, or operational changes.
How Utility Data Creates Actionable Intelligence
Once data is centralized and standardized, a few practical applications become possible that simply aren’t feasible with scattered bills:
- Site benchmarking. Comparing consumption per square meter (or per occupant, or per unit of output) across sites highlights which facilities are performing well and which warrant a closer look — something that’s meaningless to attempt with raw, unstandardized totals.
- Trend and cost tracking. Viewing consumption and cost over time, rather than bill-by-bill, makes it possible to see whether a site’s usage is creeping upward, whether a cost increase reflects higher consumption or a tariff change, and whether efficiency measures already implemented are actually holding.
- Exception and anomaly detection. A site whose consumption suddenly rises above its historical baseline — with no corresponding change in occupancy or operations — is a signal worth investigating: a stuck damper, a faulty control, or a leak, for example. Structured data, particularly when paired with automated analytics, can surface this kind of exception faster than a manual bill review.
- Supporting operational investigation. Data doesn’t replace a technician walking the site, but it tells the operations team where to look first, rather than starting from scratch.
- Management reporting. Consolidated, standardized data is what makes it possible to report portfolio-wide performance to leadership in a single, coherent view, rather than a stack of individual site bills.
Data Quality Matters
None of the above works if the underlying data isn’t trustworthy. A few practical considerations for facility teams:
- Missing readings should be flagged, not silently interpolated away. A gap in the data is different from a genuine zero-consumption period, and treating them the same distorts trends.
- Estimated bills need to be distinguished from actual meter reads. Many utility providers issue estimated bills when a meter reading wasn’t available — these should be marked as such, not blended in as if they were measured consumption.
- Unit and timezone consistency matters more than it seems. A site reporting in different units, or with billing periods that don’t align to calendar months, can silently skew month-over-month comparisons.
- Meter mapping needs to stay current. If a meter is decommissioned, replaced, or reassigned to a different area of a building, historical continuity can break unless that change is properly tracked.
Inaccurate or inconsistent data doesn’t just produce a slightly-off number — it can lead a team to investigate the wrong site, or miss a real problem because it’s buried in noise.
Utility Data Management vs. Energy Management Systems
It’s worth being clear about where utility data management ends and an Energy Management System (EMS) begins, since the two are related but distinct.
| Utility Data Management | Energy Management System (EMS) | |
| Core focus | Collecting, standardizing, and analyzing utility bills and meter data | Ongoing, typically real-time monitoring and control of consumption |
| Primary output | Structured data, benchmarks, reports, and flagged exceptions | Live dashboards, automated control actions, continuous oversight |
| Time relationship to data | Often works with billing-cycle or periodic meter data | Frequently works with real-time or near-real-time sensor data |
| Typical use | Understanding historical and comparative performance across a portfolio | Actively managing and adjusting consumption as it happens |
In practice, the two work together: utility data management establishes the historical, portfolio-wide picture — which sites need attention and why — while an EMS provides the ongoing, real-time layer that helps act on that picture day to day. Neither replaces the other; utility data management is closer to the “understand and compare” function, while an EMS is closer to the “monitor and control” function.
What a Multi-Site Utility Data Approach Should Include
A practical framework for facility and energy managers evaluating their current approach:
- Centralized data collection across all sites and utility types (electricity, water, gas, district cooling where relevant) — not scattered across inboxes and local spreadsheets
- Standardized units and reporting periods, so comparisons across sites are actually comparing like with like
- A data quality process, including handling for missing readings and estimated vs. actual bills
- Normalized benchmarking — consumption per square meter, per occupant, or another relevant unit, not raw totals
- Actionable reporting — historical trends, exceptions, and portfolio-level insights that feed into a defined next step, such as investigation, maintenance, or budget planning, rather than sitting as a report nobody reviews
How EcoSmart Approaches Utility Data Management
EcoSmart’s approach centers on PYRO ONE, an AI-powered utility billing and energy analytics platform delivered as a SaaS solution hosted locally in the UAE. Its core features include centralized bill management, advanced reporting and dashboards, AI-based analytics and anomaly detection, and integrations with IoT devices and CAFM systems.
For organizations managing multiple sites, EcoSmart’s cloud-based utility billing offering supports complex, multi-location projects generating a large volume of utility bills, with complete meter-to-cash lifecycle management. On-premises and fully managed billing-as-a-service options are also available for organizations with different infrastructure or operational preferences.
Once utility data is structured, EMASS (EcoSmart’s Energy Monitoring and Sustainability Suite) provides the ongoing, real-time monitoring and control layer, available in cloud or on-premises deployments.
Conclusion
The gap most multi-site facility teams face isn’t a shortage of utility data — it’s the absence of a structured way to turn that data into something usable. Centralizing bills and meter readings, standardizing them into comparable units, and applying fair, normalized benchmarking is what makes it possible to actually compare sites, catch anomalies early, and make decisions grounded in evidence rather than a stack of individual invoices.
For organizations managing multiple facilities, that shift — from managing bills to managing information — can turn utility data from a monthly administrative task into an operational asset.
Explore how better utility data visibility can support smarter decisions across your portfolio.